Contacts per X - der Nordstern der Kontaktreduzierung
Service managers need suitable measurement tools (KPIs) to set targets and measure the effectiveness of contact reduction. Absolute contact numbers and relative percentages are unsuitable. Instead, precisely defined contact rates are required, to set smart targets and measure the progress and cost-effectiveness of measures.
What is the problem?
Service managers are increasingly required to provide concrete evidence of the economic benefits of their projects and initiatives. Of course, this applies equally to all contact reduction projects. Often, a simple before-and-after comparison of the absolute number of contacts is supposed to "prove" success. In volatile business environments, however, this approach is rarely precise enough and often does not stand up to critical scrutiny.
What we need is a KPI that
- can track the progress and effectiveness of contact reduction measures
- evaluates the cost-effectiveness of improvement measures in a comprehensible, objective and fair manner
- enables "smart" targets to be set.
We remember WOCAS Practice Guide #03 (–> WPG#03): In a joint workshop, those responsible in the organization gained clarity about the strategic allocation of contact requests in the value/irritant matrix. Afterwards, they prioritized appropriately defined measures.
Example:
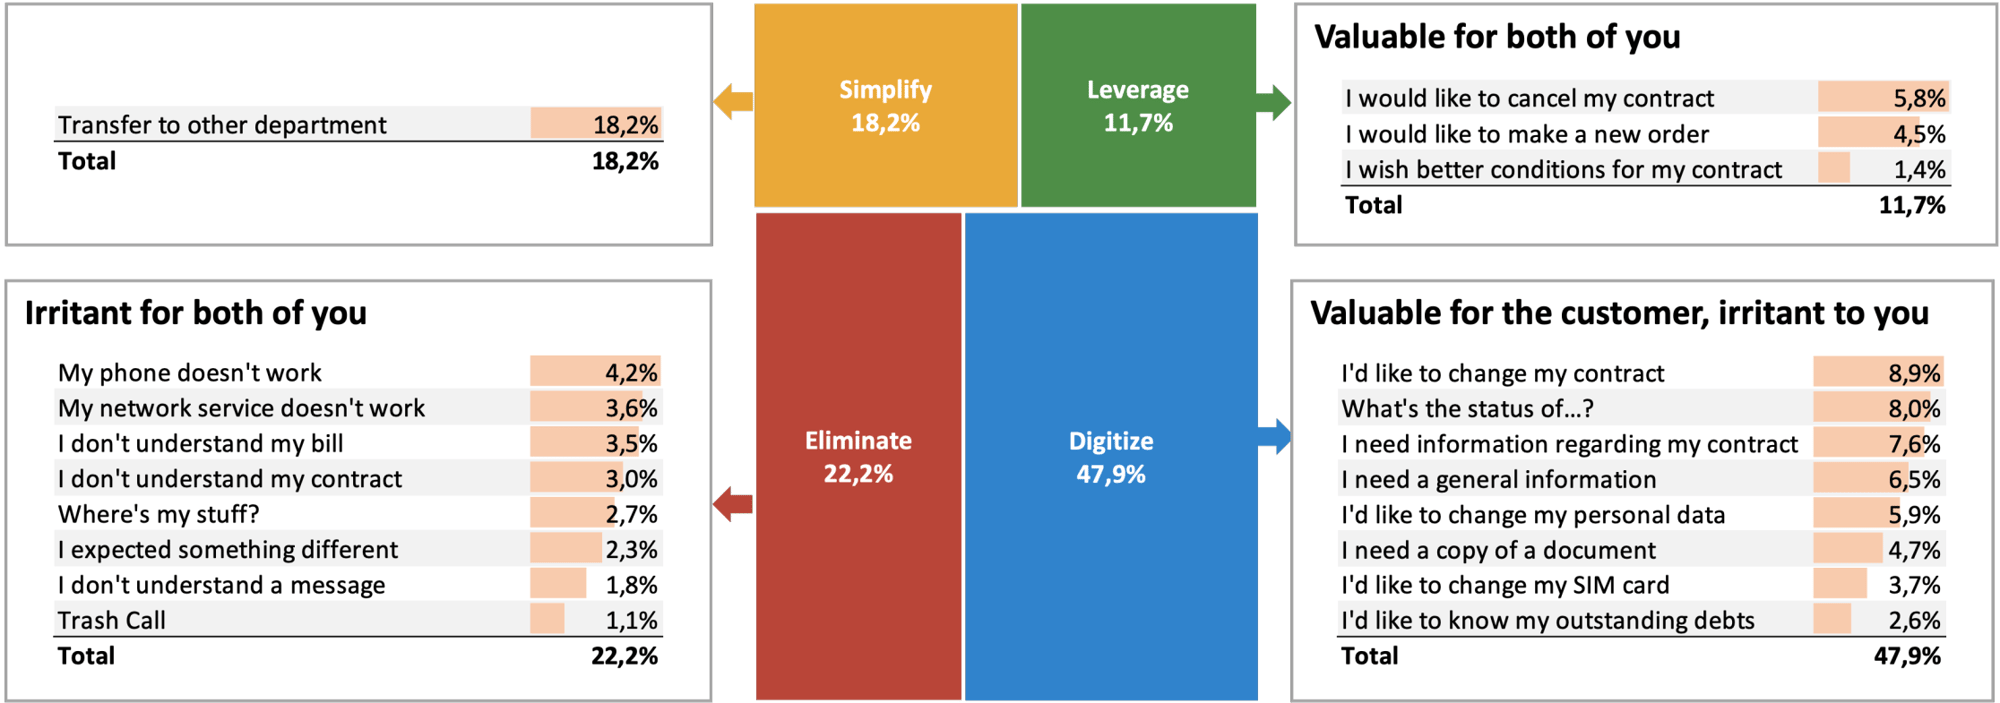
After prioritizing the measures, it is important to select the right KPI to measure the effectiveness of the individual measures.
Rates instead of counting!
We use contact rates instead of absolute volumes.
The number of contacts for a particular contact reason is often used to assess the effectiveness of contact reduction. However, even if the quality of the invoice form remains the same, the number of contacts can change to "I don't understand my invoice" if the customer base increases. This means that the number of contacts for an issue is unsuitable for a fair before-and-after measurement.
Is the percentage share of a concern in the total contacts a suitable measure for measuring the success of contact reduction? Unfortunately not. This percentage is relative and can change if the contact volume of other concerns changes.
Instead of absolute contact numbers and relative percentages, we use precisely selected contact rates.
Contact rates Cp(x) are easily measurable and comprehensible
For example, the following data can be considered for size X:
- the number of all customers or the number of a subset of all customers (e.g. existing customers or the separation of new customers, who often have an above-average number of contacts with the company in the start-up phase).
- the number of all contracts or a subset of these contracts (e.g. contracts from different insurance lines).
- Transactions (e.g. orders, bookings, sales in eCommerce).
- a specific stage in the customer lifecycle (e.g. in the customer journeys "I Pay", "I Join" ...).
- the number of certain business transactions (e.g. insurance claims).
The appropriate X for a measure, project or program should be selected carefully and with caution..
Example: An energy supplier pursues a "Zero Issue, Digital First, Personal Advisor Second" service strategy. This means a clear strategic focus of the organization on a smooth after-sales customer experience. The implementation of this strategy prioritizes the elimination of the causes of contact issues that are of no value to the customer or the company (red eliminate quadrant). The implementation then focuses on optimizing the digital service channels (blue digitize quadrant) (–> WPG#03).
Suitable contact rates were defined for each concern in the eliminate quadrant as a KPI for measuring target achievement. For example, for the request "I don't understand the dunning":

The quantified contact structure can be used to determine the number of contacts for "I don't understand the dunning". With the number of dunnings sent, provided by the finance department, the current contact rate can be easily determined and a target value derived from this. The breakdown of the customer intent at the second level then results in concrete and feasible approaches and fields of action for achieving the target.

Contact rates are also indicators of the quality of a process or CX design. A high contact rate can indicate problems such as confusing information, complex processes or a lack of self-service options for customers.
Another advantage of using contact rates is the ability to set smart goals (specific, measurable, achievable, relevant and time-bound) and to track long-term trends through repeat measurements.
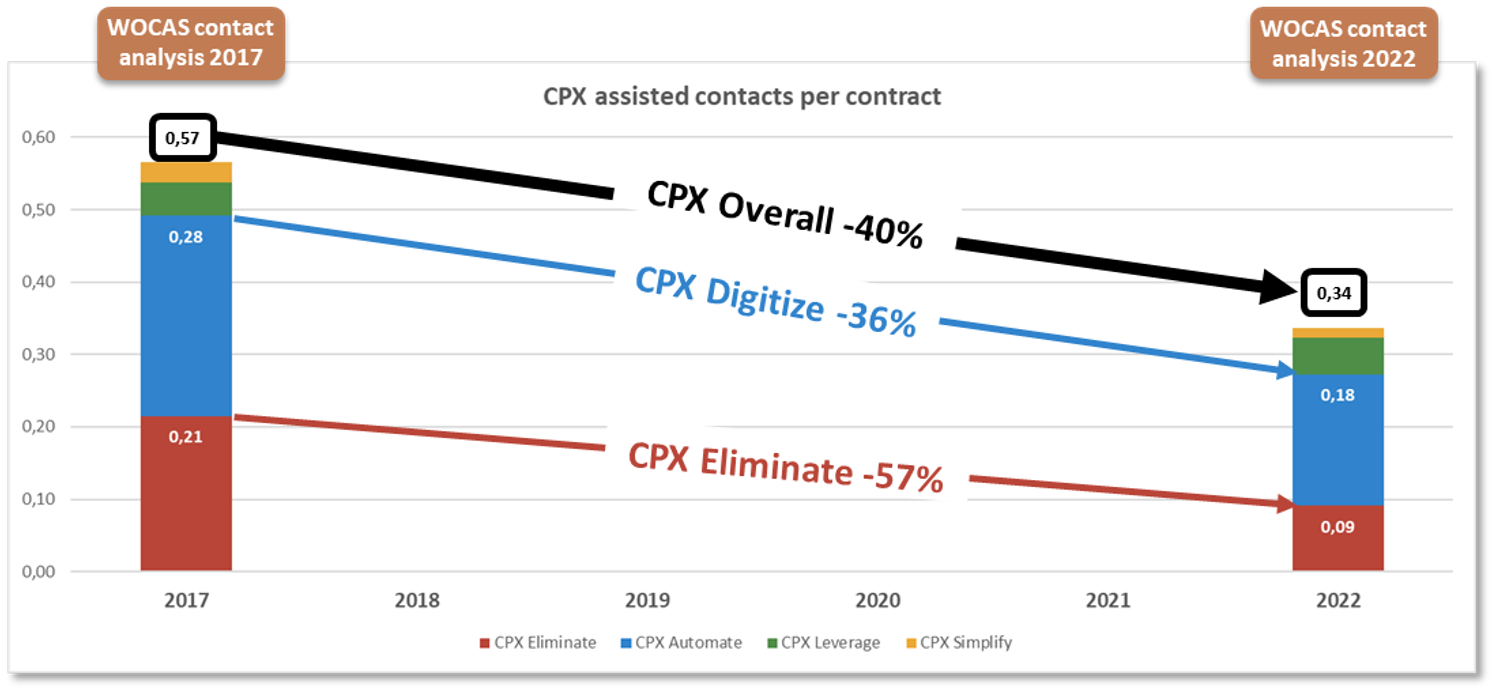
Nothing happens on its own!
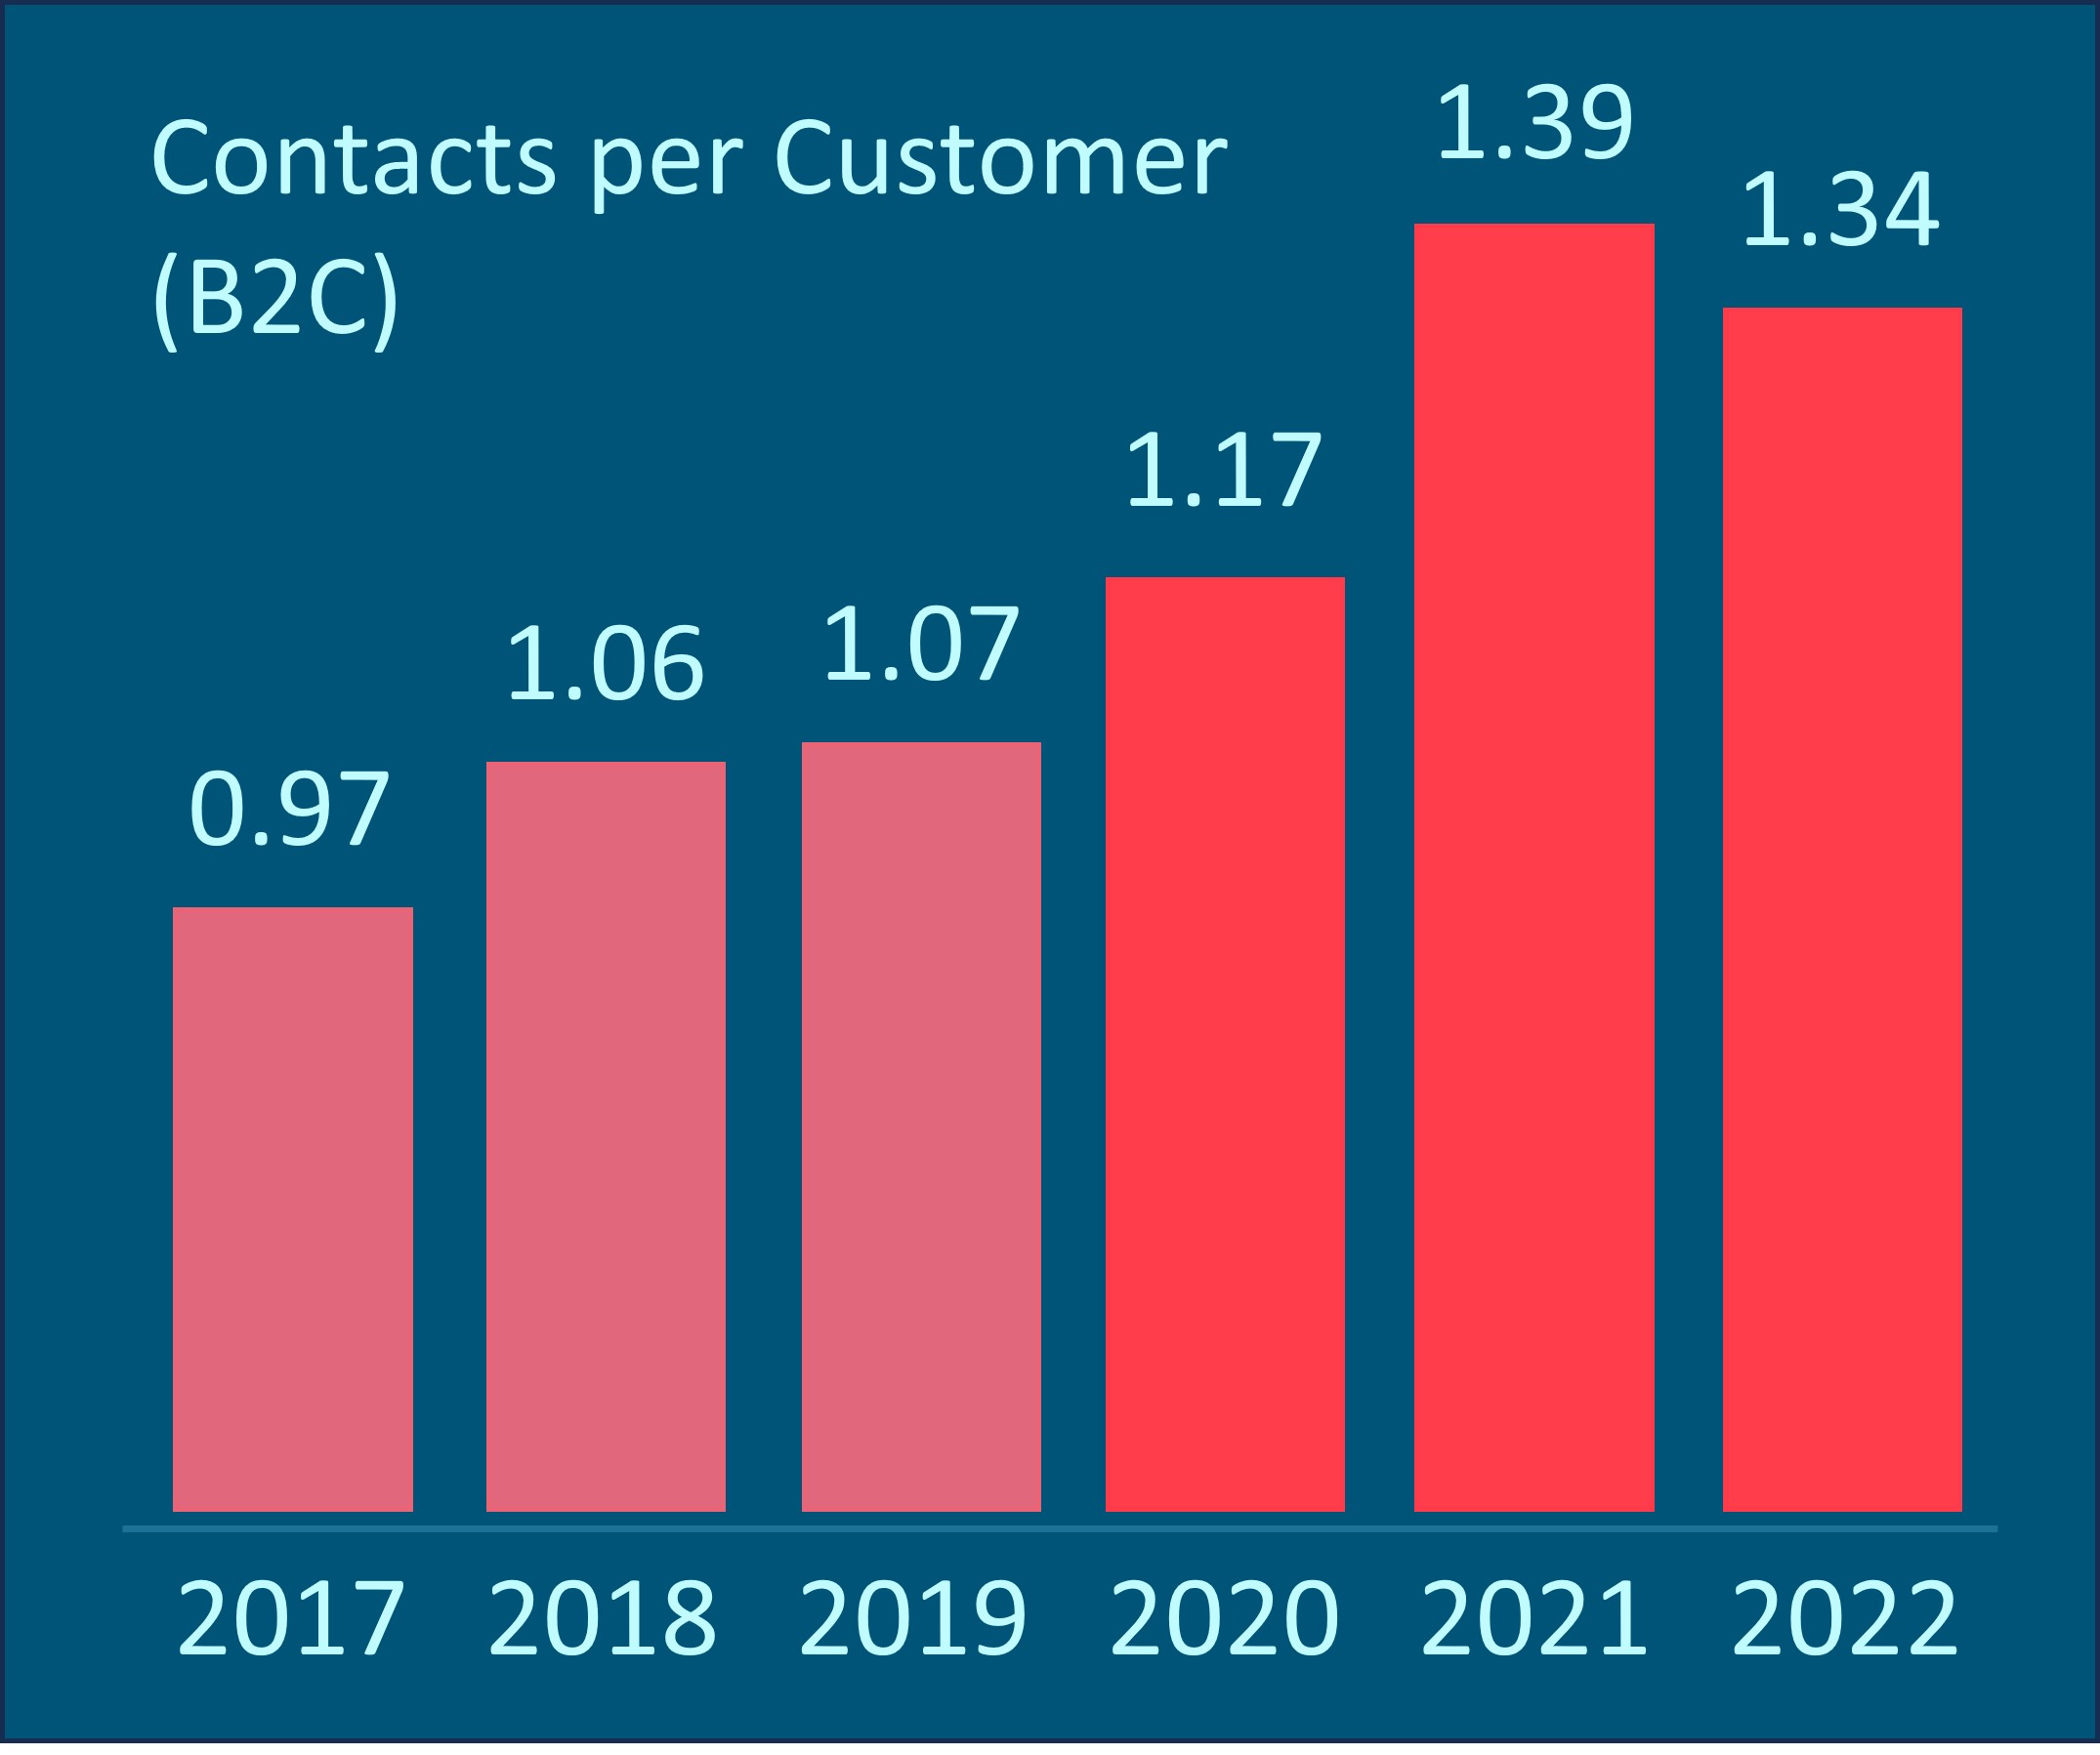
The Service Excellence Cockpit of FORWARD PARTNERS AG has confirmed a worrying trend that is more than alarming: A significant increase in contacts per customer over the last five years!
The data basis of the Swiss management consultancy is over 200 companies from various sectors in the D-A-CH region. (Service Excellence Cockpit - Report 2022)
Many contacts per customer mean high costs and often poor customer experiences. It's high time to systematically analyze the causes of contact, eliminate unnecessary contacts and improve digital channels. No pressure
How WOCAS® can support you with your analyses
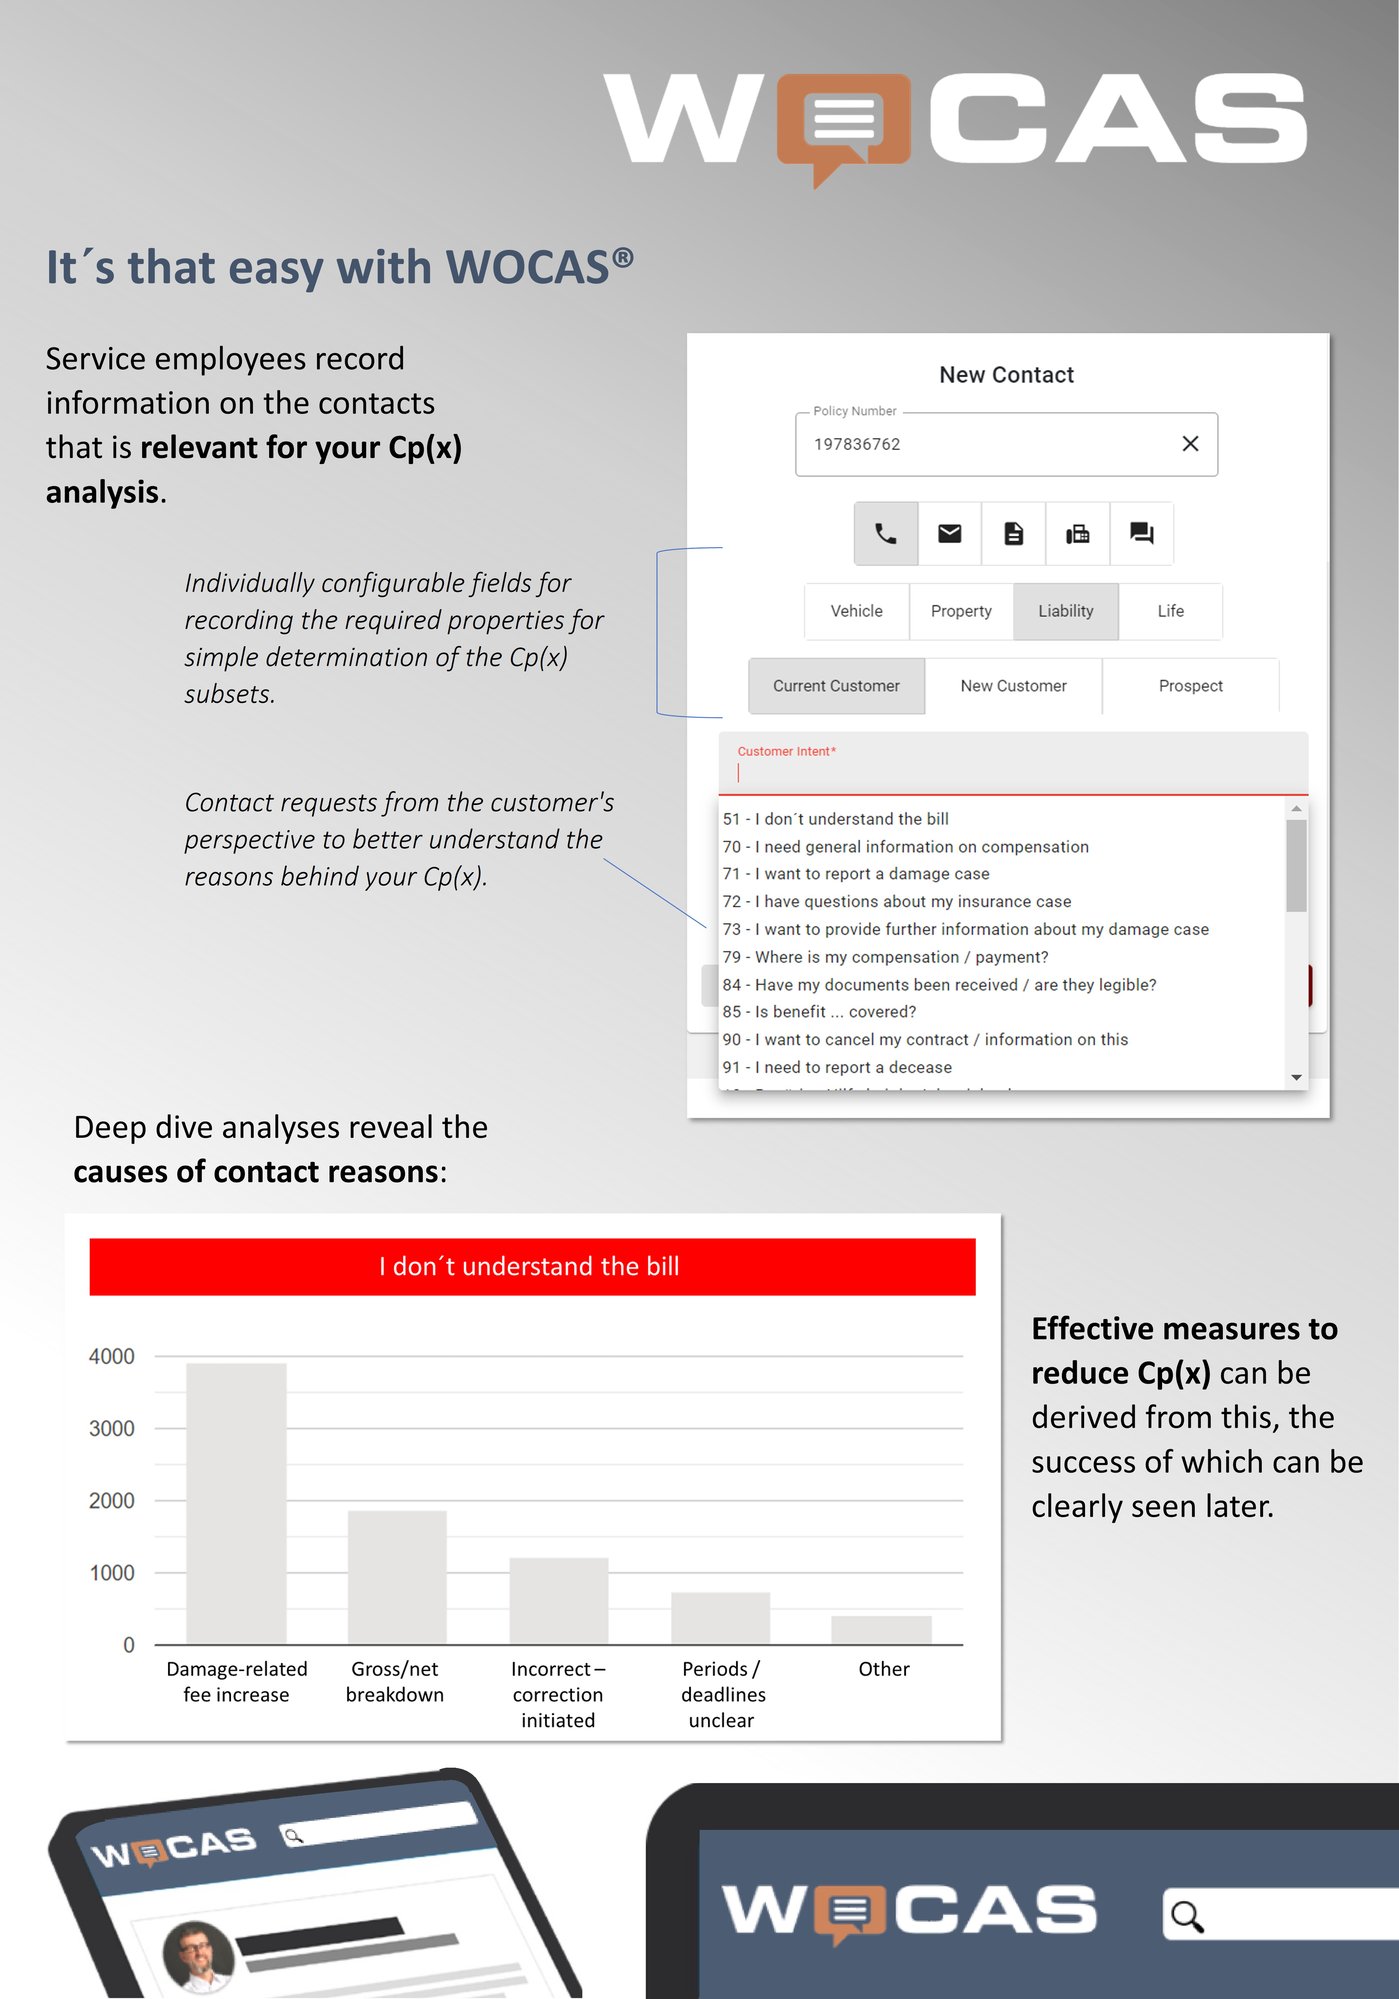
With WOCAS®, we offer you an optimal tool for linking contacts with the appropriate business volume (X). This is the basis for setting targets and the fields of action for achieving them.
Feedback
We would be very glad to receive likes and comments or if you share our practice tip to make it accessible to other interested parties. You can do this by following our LinkedIn company page.
Want to talk to us? - Great!
We look forward to hearing about your challenges in a non-committal conversation and finding out together how WOCAS can help you.
